Графики и таблицы пример 10
08.20.2021 10:31
Данный пример показывает выполнение задания с круговой диаграммой и гистограммой вместе.
Задание, где необходимо две диаграммы вместе зачастую сбивает кандидатов с толку, поэтому посмотрите внимательно на график и прочтите предоставленный вариант ответа, для успешного написания задачи подобной сложности.
Model Graph
You should spend about 20 minutes on this task.
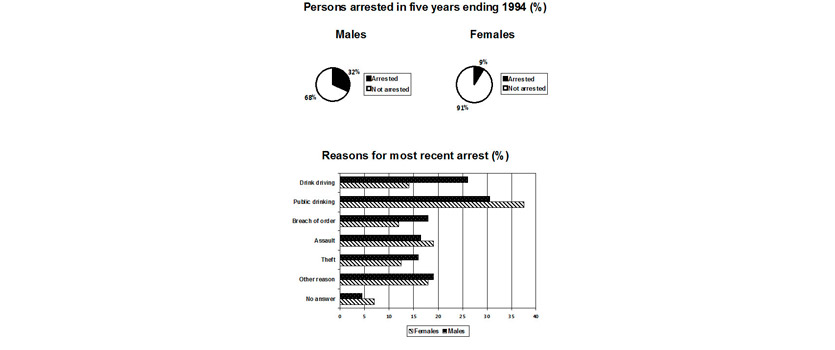
The pie chart shows the percentage of persons arrested in the five years ending 1994 and the bar chart shows the most recent reasons for arrest.
Summarize the information by selecting and reporting the main features and make comparisons where relevant.
Write at least 150 words.
IELTS Pie and Bar Chart Arrests
IELTS Pie and Bar Chart - Model Answer
The pie chart illustrates the percentage of males and females who were arrested from 1989 to 1994, while the bar chart compares the main reasons that the different genders were arrested most recently. It is evident from the charts that males were arrested more than females and that public drinking was the most common reason for arrest for both.
To begin, the proportion of males arrested was much greater than for females. 32% were arrested compared to only 9% for women. Turning to the reasons for the most recent arrests, there were some clear differences between men and women. Men were twice as likely to be arrested for drink driving than women, at 26% and 14% respectively. Breach of order, theft, and other reasons were also slightly higher for men, with all these offences standing in the range of 12-18% for both sexes. Interestingly though, women experienced a higher percentage of arrest rates for assault and public drinking. The figures for assault were fairly similar at approximately 18%, whereas public drinking represented the main reason for arrest, with women at a massive 38%, compared to 31% for men. In a small percentage of cases, no answer was given.
(198 Words)
Комментарии
Одной из больших преград студенты IELTS могут, столкнуться это незнание или не умение описывать сразу две диаграммы одновременно, особенно если необходимо описать круговую диаграмму и гистограмму.
Самый лучший способ справиться с этой задачи это описывать графики каждый по отдельности, нежели чем пытаться их связать.
Как видно из примера сначала были описаны данные круговой диаграммы, а потом гистограммы.
Не забывайте что в вступлении нужно сделать обзор как круговой диаграммы так и гистограммы.
